
What We Actually Instrumented — and What We Found
Or: Three Engineers, One Hardware Correlation, and the Test Suite Nobody Was Running
The laptop was three years old. That’s not a detail anyone had written down anywhere.
It sat on the desk the way old laptops do — slightly warmer than it should be, fan spinning at a frequency that had become background noise months ago. The engineer using it had filed no complaints, raised no ticket, mentioned nothing in standup. Builds were slow. Builds were always slow. You learned the rhythm of it: hit run, switch tabs, come back. It was just how things were on that machine, in the same way there was Coffee Mate and not milk in my coffee that morning — it’s just the way things were. You stop questioning the water you swim in.
We found the laptop with data. Not with a conversation, not with a complaint, not with a survey. With telemetry that we’d built to measure something else entirely.
That’s the thing about actually measuring the inner loop: you find problems you didn’t know to look for.
First, What We Were Trying to Measure
Post 1 made the case that the inner loop is unmeasured in most engineering organisations — the tight cycle of write, build, test, see that engineers live in all day, every day, while production monitoring stays green and dashboards stay happy. If you haven’t read it, The Inner Loop Nobody Measures is the place to start. This post is about what we actually did about it.
The goal was straightforward: instrument every meaningful link in the chain. Not just CI build time. Not just compile time. The whole thing, on developer machines, as engineers actually experience it.
The inner loop isn’t one event. For a .NET backend service, it looks like this:
compile → startup → prewarm / first request → browser ready
For a frontend change:
save → HMR → browser update
For a test run:
trigger → Fixture start-up → execution → result
Each link can degrade independently. Each link had, in our case, degraded independently, at different times, for different reasons, completely invisibly. We needed to measure all of them — separately, because aggregating them hides exactly the kind of problem we were trying to find.
Zero Friction by Design
Before we get into what we found, a word on how the collection works — because the design choice here matters enormously.
We made a deliberate decision early: the telemetry had to be invisible to engineers. Not opt-in. Not a tool they had to remember to run. Not a script to execute, a config to set up, or a plugin to manually install. Zero friction meant zero friction — the data had to just happen, as a consequence of the normal act of building and testing code.
For .NET, that meant MSBuild and test reporter plugins that hook automatically into the build pipeline, and middleware that's imported only on debug runs automatically from an IHostingStartup:
dotnet add package Agoda.Builds.Metrics
dotnet add package Agoda.DevFeedback.AspNetStartup
That’s the entire engineer-facing installation. The MSBuild plugin instruments compile time. The ASP.NET package instruments startup time and time to first response — separately, because as Somchai taught us, those are not the same number. After the next build, data starts flowing.
For frontend, it’s a one-line addition to a Vite or webpack config after installing the package:
npm install agoda-devfeedback-vite2
# or
npm install agoda-devfeedback-webpack
# or
npm install agoda-devfeedback-rsbuild
Data goes to a central endpoint, configured via a DEVFEEDBACK_URL environment variable — or via an internal DNS record, which means zero per-machine configuration at all for teams where you want it truly invisible. The endpoint is Agoda.DevExTelemetry, the open-source dashboard we'll cover in Post 3. It stores everything and makes it queryable across teams and over time.
Worth being explicit about what we collect: build performance timing and hardware specs. Not what anyone is working on, not file names, not diffs. Just timing and machine metadata. The fact that both the clients and the dashboard are open source means anyone can inspect exactly what gets sent — transparency as a design principle, not an afterthought.
Most engineers don’t know the telemetry is running. Some still don’t. That’s by design.
What Compile → First Response Actually Looks Like
The Somchai finding from Post 1 — that a 30-second compile was hiding a five-minute debug cycle — became the clearest example of why splitting the chain matters.
The compile metric was accurate. It was measuring one link. The dashboard shows all three .NET links separately: compile time, ASP.NET startup time, and time to first response. When you put them side by side, the picture is completely different from what any single metric would suggest.
In our case: compile was fast, startup was reasonable, and first response was where everything collapsed. The service was running a web server prewarm routine at startup that pulled real data from QA servers in the data center — cache population, database warm-up, dependency initialisation. All of it legitimate. All of it adding four and a half minutes to every debug cycle. All of it happening in the gap between “startup complete” and “something I can actually click on.”
Once it was visible, it was fixable. The prewarm routine got moved to a background task after the host reported ready. First response time dropped. Engineers stopped needing a ritual to fill the wait time.
The fix took less than a day. Finding it took months of the problem existing invisibly.
Finding 1: The Laptop Nobody Knew Was Slow
The hardware correlation finding arrived before we expected it.
Almost immediately after the first rollout of the webpack telemetry, three engineers showed up as outliers in the build data. Not slightly slower — nearly double the median time, consistently, across multiple days and build types. Because the telemetry collected hardware data alongside build performance, we could correlate the two. The three outliers were all running 7th generation Intel chips. Their laptops hadn’t been renewed in three years.
We got them new machines within the week.
The obvious takeaway is that we found and fixed a hardware equity problem. But there’s a less obvious one: those engineers knew their builds felt slow. They’d adapted to it. Without a comparison — without “your webpack time is 1.9x the team median and here is the chart” — there’s no lever to pull. The feeling of “my machine is slow” is easy to dismiss or deprioritise. The data created the justification for action.
There’s also a more uncomfortable version of this finding: how many engineers on your team are running old hardware right now, have adapted to it, and have never said anything because they’ve normalised the experience? You won’t find out with a survey. You’ll find out with data.
As the statistician George Box wrote, “All models are wrong, but some are useful.” Our model of developer productivity had no term for hardware variation because we’d never measured it. Adding the measurement didn’t make the model right — it made it less wrong in a way that mattered.
Finding 2: The Test Suite Nobody Was Running
The second finding came from a comparison we almost didn’t think to make.
We were looking at test execution rates — how often given test suites were being run. We had CI data, which told us how often suites ran in the pipeline. We had local data from the test reporter plugins, which told us how often suites ran on developer machines.
For some suites, those numbers were radically different.
Certain test suites were running constantly in CI and almost never on local machines. The local execution rate was close to zero on days with active development on those services. We started asking why.
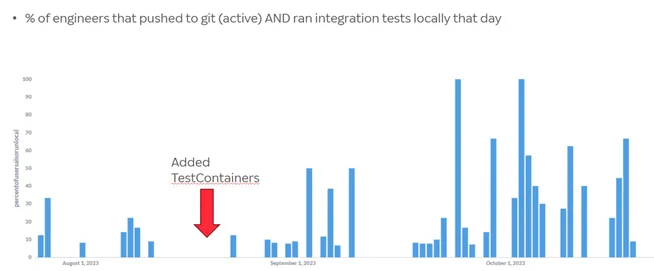
The answer: Docker Compose with bash scripts and sleeps. Running those tests locally meant dropping out of the IDE, opening a terminal, executing a setup script, waiting for multi-gigabyte containers to spin up, hoping the timing worked, and based on laptop hardware sometimes you would need to vary the sleep time, and then running the tests from your IDE. Engineers had stopped bothering. They’d learned, through experience, that it was faster to just push and let CI handle it. Entirely rational individual behaviour in response to a friction-filled system. Completely invisible unless you’re comparing local execution rates against CI execution rates for the same suite.
Here’s why that matters: when engineers can only run tests in CI, CI becomes part of the inner loop. They write code, push, wait for the pipeline — anywhere from five to forty minutes depending on your setup — read the result, fix, push again. That’s not a fast feedback loop. That’s the outer loop dressed up as a local development workflow.
And CI stayed green the entire time. The tests were passing. The test suite was technically healthy. The inner loop was broken.
The fix was migrating those test suites to Testcontainers — self-contained, IDE-integrated, fast enough to run as part of the normal “Run All Tests” action. No terminal switching, no script execution, no timing-dependent startup. After the migration, local execution rates on those suites went from around 20% to 70% on days with active contributors. The full migration story — Docker-in-Docker CI gotchas, parallel execution, data seeding — is in Stop Copying Prod Into Dev if you want the technical detail. What matters here is that we didn’t find the problem through a retro, or an engineer complaint, or an architectural review. We found it because we were looking at a number nobody had been looking at before.
What the Coverage Actually Looks Like
Across the .NET, JavaScript/TypeScript, and JVM stacks, the instrumentation now covers:
For .NET: compile time (incremental and full, via MSBuild), ASP.NET startup time, time to first response, and test run duration for both NUnit and xUnit.
For JavaScript and TypeScript: webpack and Vite full build time, HMR time (the one CI has never seen), and Jest and Vitest test run duration. Which we used for this comparison between vite and rspack.
For JVM: Gradle via the Talaiot plugin, JUnit, and ScalaTest. JVM is the least mature coverage area — the collection libraries exist and are open source, but they haven’t received the same investment as the .NET and JS clients. If you work primarily in Kotlin, Scala, or Java and want to improve this, contributions are genuinely open and genuinely appreciated. The JVM ecosystem deserves the same quality of inner loop telemetry as .NET and JS.
The whole system is running across roughly 700 engineers at Agoda. That’s enough data to surface patterns that wouldn’t be visible at smaller scale — the hardware correlation being the clearest example — but the instrumentation is designed to be useful at team scale too.
What Good Ownership Looks Like Here
One thing worth naming explicitly: the dashboard doesn’t tell teams what to do with the data. It makes the data visible. What teams do with it is their call.
This is the same model as production monitoring. You wouldn’t centralise incident response into a platform team and have product teams ignore their own Grafana dashboards. The inner loop deserves the same ownership structure: the team that built the service is the team that runs it, and the team that runs it is the team that should own what their developer experience actually looks like. The platform provides the tooling. Teams own the signal.
The teams that have engaged with this most have done so because the data gave them something concrete to point at. Not “our builds feel slow” — a feeling, easy to dismiss. But “our first response time is 4 minutes 47 seconds at P75, and three months ago it was 40 seconds” — a number with a history, easy to act on.
The Tool That Makes This Possible
Everything above — the compile and startup split, the hardware correlation, the local vs CI execution comparison — runs through a single open-source dashboard: Agoda.DevExTelemetry. It's the missing piece: somewhere for the data to go that makes it visible, aggregatable, and actionable across teams.
Post 3 covers the architecture, the ingest endpoints, the dashboard views, and exactly how to get your own data flowing: Introducing Agoda.DevExTelemetry.
Or if you want to go straight to the repos:
- Dashboard: https://github.com/agoda-com/Local-Dev-Telemetry-Manager- .NET clients: https://github.com/agoda-com/dotnet-build-metrics- JS clients: https://github.com/agoda-com/devfeedback-js- JVM clients: https://github.com/agoda-com/java-local-metrics
Related Reading
- The Inner Loop Nobody Measures — Post 1 in this series; the case for why this matters before the how- Introducing Agoda.DevExTelemetry — Post 3; the open-source dashboard and setup guide- Bridging Worlds: Making .NET BFF and React/Vite Play Nice in Development — the BFF and Vite setup that the frontend telemetry instruments- Stop Copying Prod Into Dev: Test Data Strategies That Actually Scale — the full Testcontainers migration story; what the telemetry found, this post fixed- Semantic Monitoring: The Question You’re Not Asking About Your Production Systems — same observability philosophy applied to production; this series is the development-side complement- Starting a Paved Path with .NET Templates — where the telemetry clients belong in the paved path from day one- Mesh Programming: Where Visual Design Meets Synchronized Development — why inner loop speed directly affects collaborative design-engineering workflows